
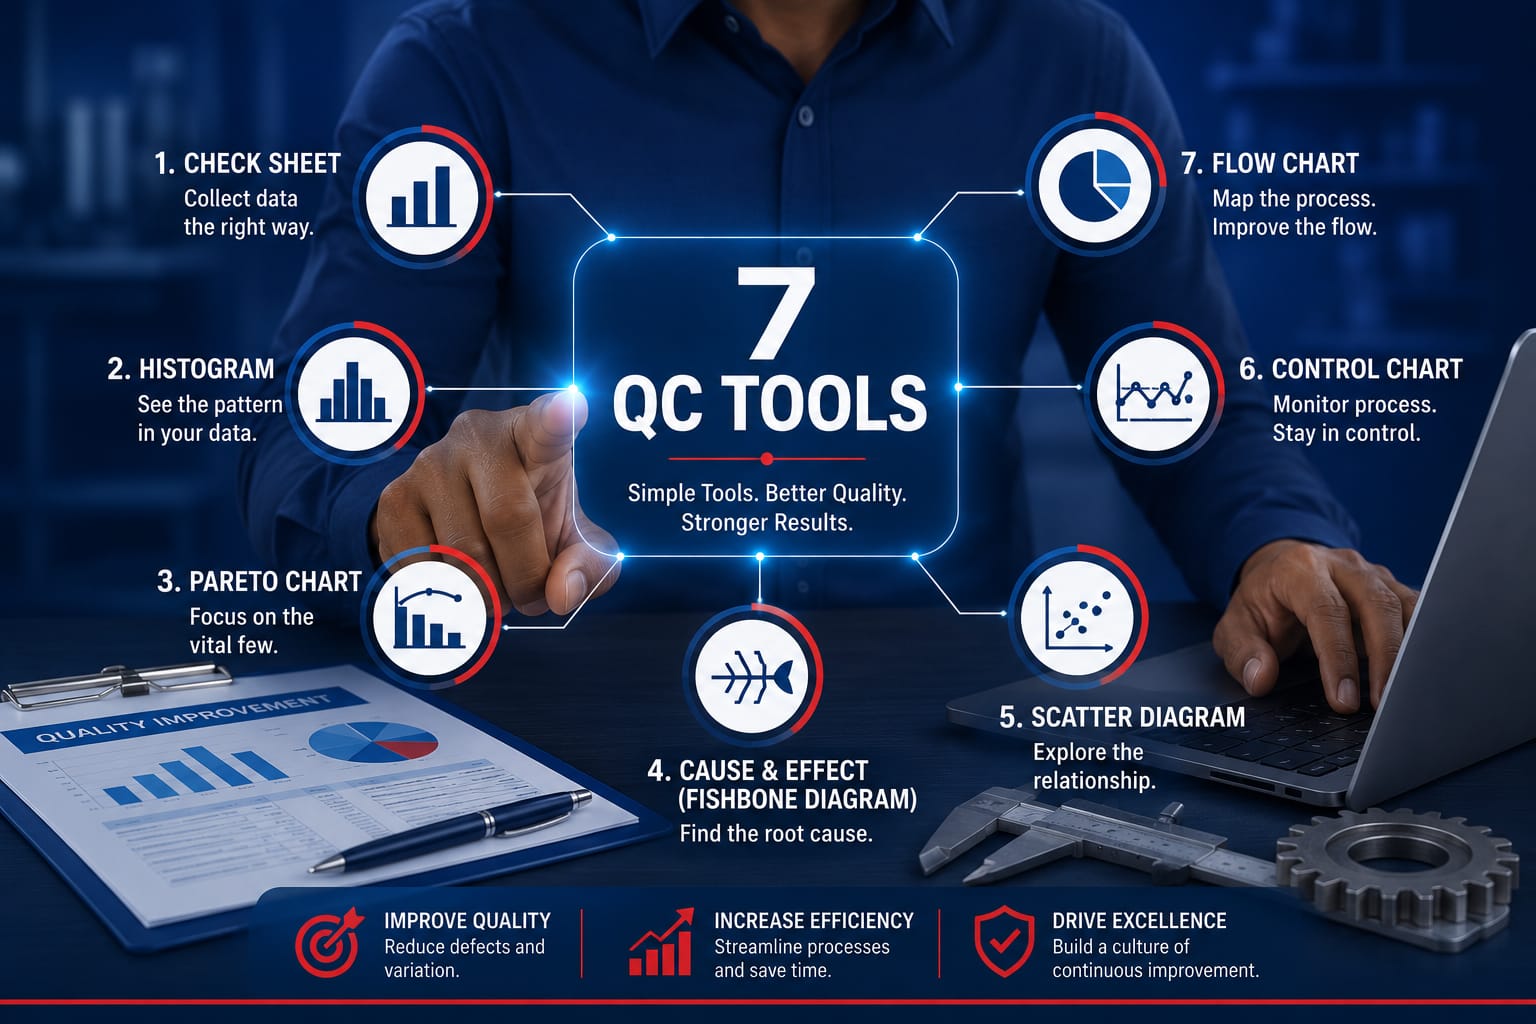
7 QC Tools for Quality Improvement Training Course

Wishlist Share

About Course

The 7 QC Tools for Quality Improvement Training Course is a practical onsite programme designed to equip participants with essential problem-solving and quality improvement techniques used in manufacturing, service delivery, and operational environments.

This course focuses on the application of the seven basic quality control tools to identify, analyse, and resolve process problems, reduce defects, improve efficiency, and support data-driven decision-making within organizations.

Through hands-on exercises, real-life case studies, and group activities, participants will learn how to apply these tools effectively in continuous improvement initiatives.

What Will You Learn?

  • Understand the 7 basic QC tools and their applications.
  • Analyse process data to identify root causes of problems.
  • Improve quality and reduce defects using structured methods.
  • Apply data-driven decision-making in operations.
  • Use Pareto analysis to prioritize improvements.
  • Visualize and interpret process variation effectively.
  • Support continuous improvement initiatives.
  • Strengthen problem-solving capabilities.
  • Improve operational efficiency and quality performance.
  • Apply QC tools in real workplace scenarios.

Course Content

Introduction to Quality Improvement
Concepts of quality and continuous improvement Importance of data-driven decision-making Overview of QC tools in process improvement Role of QC tools in ISO 9001 systems

Data Collection and Stratification
Importance of accurate data collection Methods of stratification Organizing data for analysis Identifying patterns and trends

Check Sheets
Purpose and types of check sheets Designing effective check sheets Data collection techniques Practical applications in quality control

Pareto Charts
80/20 principle in quality improvement Identifying major causes of defects Constructing Pareto diagrams Prioritizing improvement actions

Cause-and-Effect (Fishbone/Ishikawa) Diagrams
Identifying root causes of problems Categorizing causes (Man, Machine, Method, Material, etc.) Building fishbone diagrams Root cause analysis techniques

Histograms
Understanding process variation Distribution of data Constructing and interpreting histograms Identifying process stability

Control Charts
Monitoring process performance over time Common vs special causes of variation Interpreting control limits Maintaining process stability

Scatter Diagrams
Relationship between variables Identifying correlation patterns Plotting and interpreting scatter diagrams Using correlation for decision-making

Flowcharts and Process Mapping
Visualizing process steps Identifying bottlenecks and inefficiencies Process improvement techniques Standardizing workflows

Practical Exercises and Case Studies
Real-world problem-solving scenarios Group-based quality improvement exercises Data analysis practice Continuous improvement applications

Student Ratings & Reviews

No Review Yet

No Review Yet